
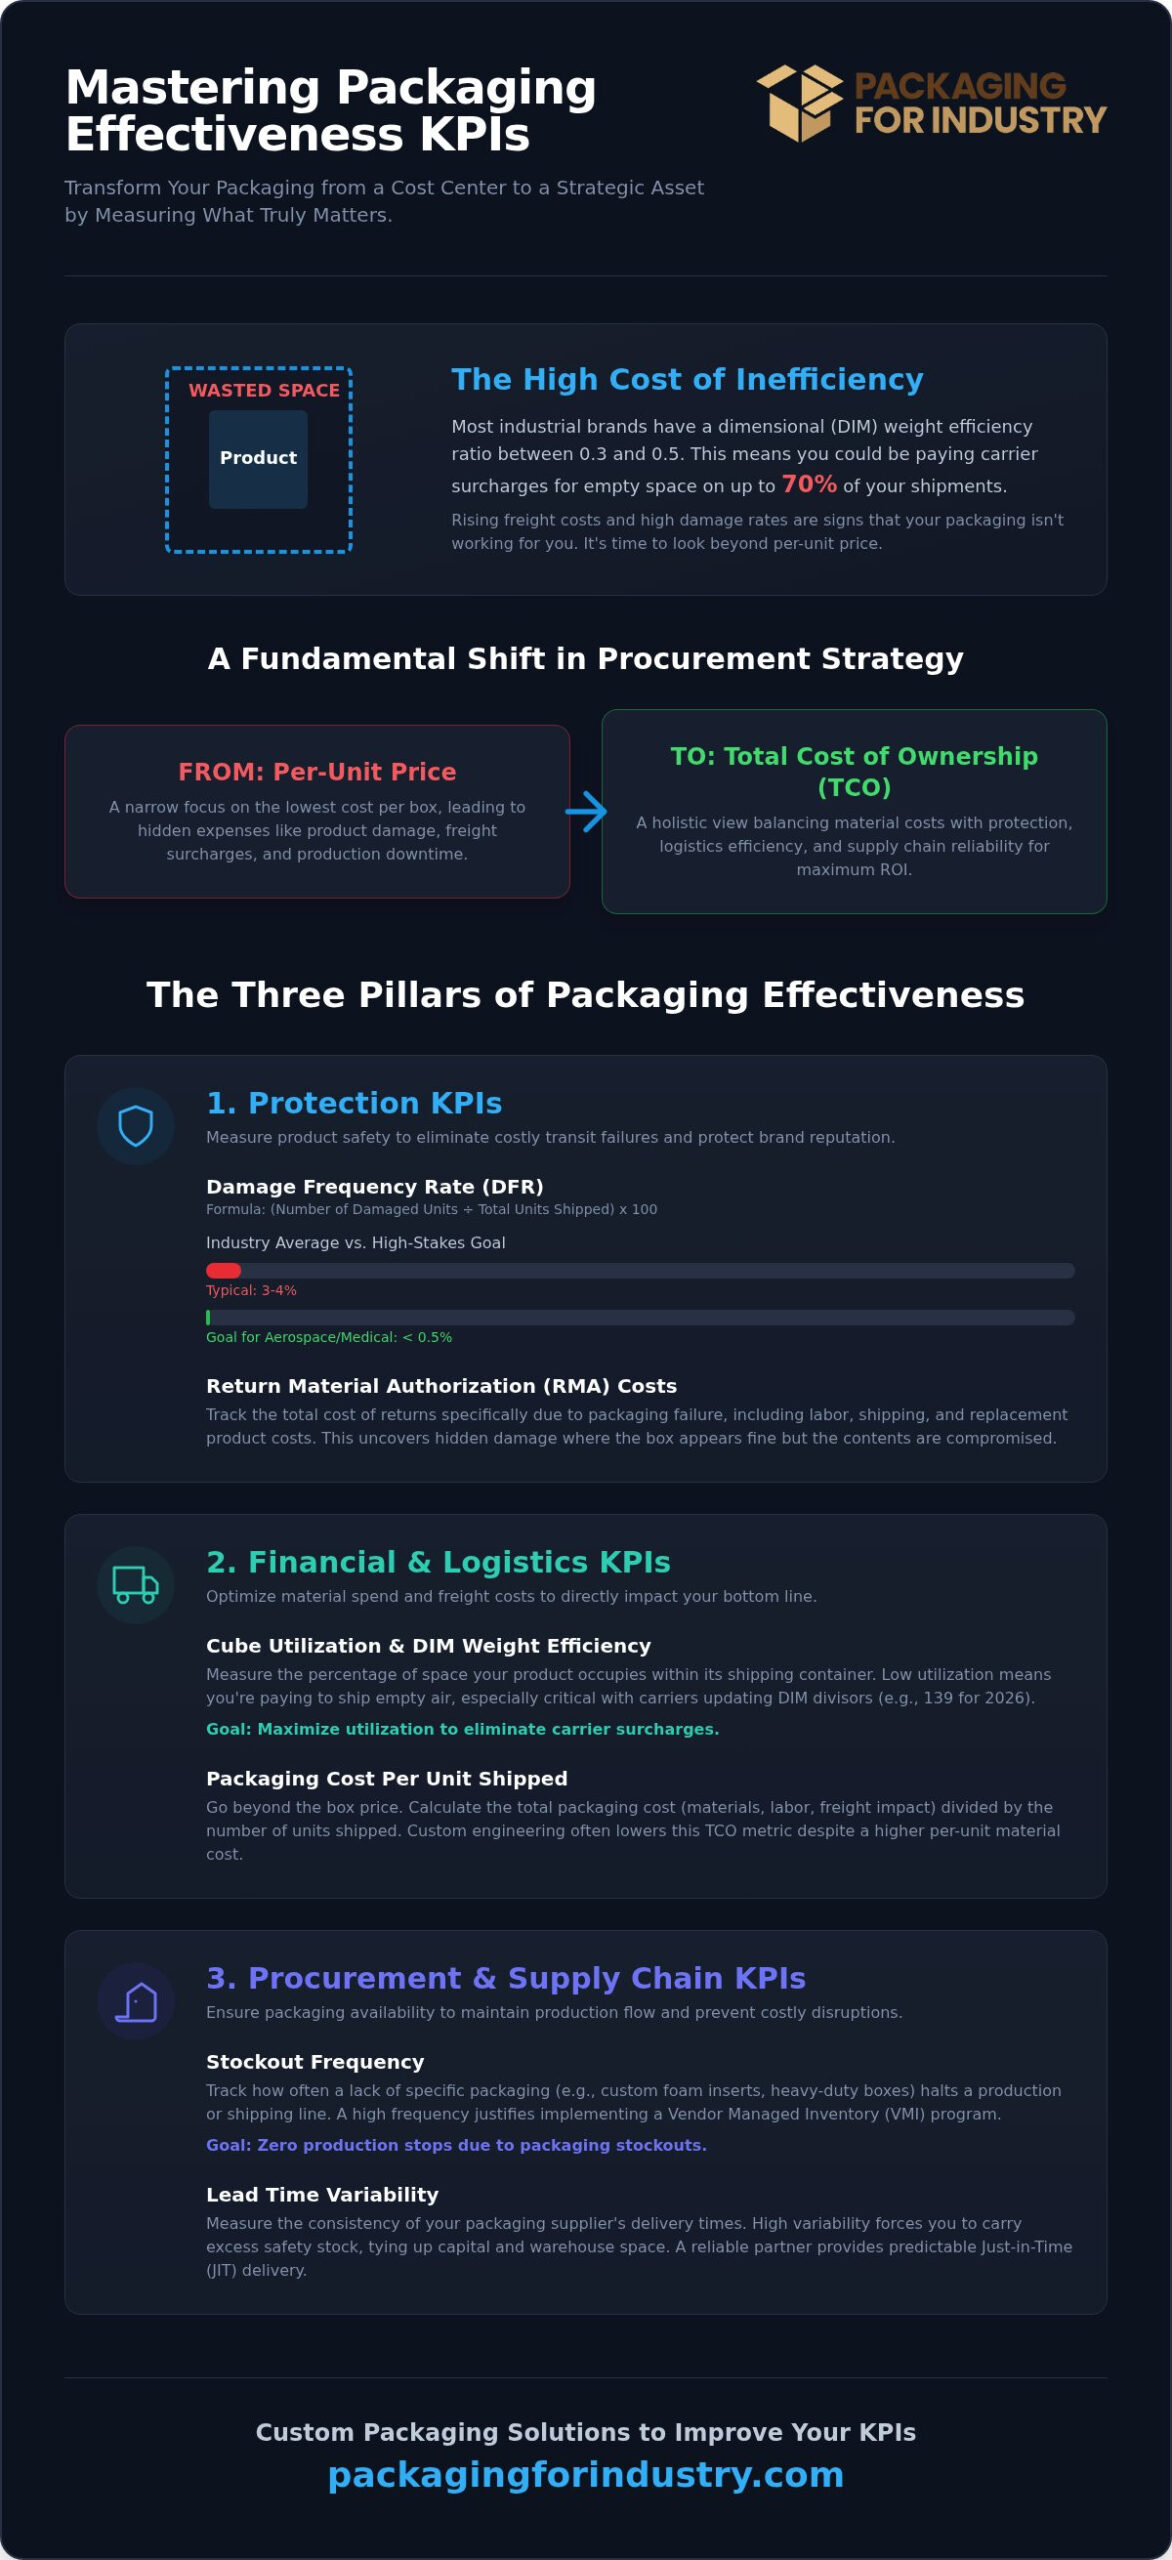
Most industrial brands operate with a dimensional weight efficiency ratio between 0.3 and 0.5. This means they’re paying carrier surcharges for empty space on up to 70% of their shipments. If you’re seeing rising freight costs alongside high shipping damage rates, your current metrics probably aren’t telling the whole story. Understanding how to measure packaging effectiveness KPIs is the first step toward reclaiming your margins and protecting your product integrity.
It’s frustrating to watch profits evaporate due to oversized corrugated boxes or frequent inventory stockouts of custom packaging. You need more than just a lower price per unit; you need a system that ensures zero production stops and a lower total cost of ownership. This guide provides a clear framework for identifying the metrics that actually matter to your industrial supply chain. We’ll explore how to analyze packaging ROI, optimize for carrier standards like the 2026 DIM weight divisors, and leverage custom engineering to eliminate the professional stress of transit failures. By mastering these data points, you can transform your packaging from a simple line item into a strategic asset for your operation.
Key Takeaways
- Learn why per-unit price is a misleading metric and how to shift your focus to total cost of ownership by balancing protection, logistics, and supply reliability.
- Discover how to calculate your Damage Frequency Rate and track RMA costs to identify where custom corrugated or foam engineering can eliminate transit failures.
- Master how to measure packaging effectiveness KPIs like cube utilization and DIM weight efficiency to stop paying carrier surcharges for shipping empty space.
- Understand how tracking stockout frequency and lead time variability can justify a Vendor Managed Inventory program to ensure zero production stops.
- Get a step-by-step framework for building a packaging KPI dashboard that prioritizes the specific needs of high-stakes industries like aerospace and medical manufacturing.
The Three Pillars of Industrial Packaging Effectiveness
Effective industrial packaging isn’t just about finding the cheapest box on the market. It’s a precise balance between three critical pillars: protection, logistics cost, and supply chain availability. When manufacturers evaluate how to measure packaging effectiveness KPIs, they often make the mistake of focusing solely on the per-unit price of a corrugated container or a roll of stretch film. This narrow view ignores the Total Cost of Ownership (TCO). A truly effective system coordinates the needs of Purchasing, Operations, and Logistics to ensure that the packaging facilitates revenue rather than draining it through hidden inefficiencies. By viewing packaging as a strategic asset, you can eliminate the professional stress caused by transit failures and unpredictable lead times.
Why Traditional Procurement Metrics Fail
Standard procurement strategies often prioritize the lowest bidding supplier to show immediate line-item savings. However, thin-walled boxes that save pennies at the loading dock often lead to thousands of dollars in Damage Frequency Rate (DFR) costs and Return Material Authorizations (RMAs). Beyond material failure, oversized packaging creates a massive financial leak in freight billing. With major carriers utilizing a 139 dimensional weight divisor for 2026 shipments, paying for “air” in a standard RSC box is a significant waste. If your packaging isn’t right-sized, you aren’t just buying cardboard; you’re paying a premium to ship empty space. Additionally, poor inventory management leads to stockouts, where a lack of custom foam or crates can halt an entire production line, creating costs that far outweigh any initial material savings.
The Strategic Role of Custom Engineering
Transitioning to custom design packaging allows your operation to move from reactive shipping to proactive logistics. By utilizing specific Package testing methodologies, engineers can validate that a design will withstand the rigors of the modern supply chain before a single order is placed. Prototyping serves as the essential baseline for establishing your performance KPIs, allowing you to prove ROI before scaling. In high-stakes sectors like aerospace and medical manufacturing, these engineering standards are non-negotiable for maintaining compliance and safety. Custom inserts and heavy-duty double or triple-wall corrugated solutions ensure that your effectiveness metrics remain high even during turbulent transit conditions. Understanding how to measure packaging effectiveness KPIs through the lens of engineering ensures that every material choice is backed by data and fiscal logic.
Protection KPIs: Measuring Product Safety and Durability
The primary function of any industrial container is to ensure the product arrives in pristine condition. When determining how to measure packaging effectiveness KPIs, the Damage Frequency Rate (DFR) serves as your most critical data point. You calculate this by dividing the number of damaged units by the total number of units shipped. While the industry average for transit damage typically hovers between 3% and 4%, specialized sectors like aerospace or medical manufacturing often require a near-zero tolerance. High DFR numbers don’t just represent lost product; they indicate a failure in the engineering of your corrugated or foam solutions. Tracking these metrics allows you to identify whether your current materials are structurally sufficient for the rigors of the modern supply chain.
Beyond simple breakage, you must track Return Material Authorization (RMA) costs specifically attributed to packaging failure. This includes hidden damage where the external box appears intact, yet the internal components have failed due to vibration or shock. Leading indicators, such as impact testing results, provide a proactive way to assess risk. Following updated standards like the ISTA 3E-2026 protocol, which recently revised compression formulas for palletized loads, ensures your testing aligns with real-world transit conditions. An academic case study on packaging efficiency highlights that balancing material-to-product ratios is essential; over-packaging low-value items is a waste of capital, while under-packaging high-value equipment is a liability.
Tracking Damage by Material Type
Effective protection requires matching the right material to the specific vulnerability of the product. Manufacturers should compare the performance of custom foam packaging, such as polyethylene or ESD-safe inserts, against standard dunnage. Foam provides superior shock absorption that generic fillers cannot match. For palletized shipments, measuring the effectiveness of corner and edge protection is vital for maintaining load integrity. If your DFR is high despite using heavy-duty boxes, the issue may lie in the lack of structural support at the pallet’s pressure points. Analyzing damage patterns helps determine if a shift to custom-engineered crates or specialized cushioning is necessary to protect your bottom line.
The Cost of Packaging Failure
A single shipping failure costs significantly more than the price of the replacement part. To find the true cost, you must aggregate freight charges for the return, the labor required for inspection and repacking, and the expedited shipping for the replacement. High damage rates also erode customer trust, which is a difficult metric to recover in B2B relationships. If your current protection KPIs are trending in the wrong direction, it’s time to request for a packaging quote for a custom-engineered solution. Transitioning to data-backed designs ensures your packaging spend is an investment in reliability rather than a recurring operational loss.
Financial & Logistics KPIs: Optimizing Freight and Material Spend
Packaging spend is often viewed as a fixed cost, but it’s one of the most adjustable levers for improving your bottom line. When analyzing how to measure packaging effectiveness KPIs, you must look beyond the invoice price of materials. Cube utilization is a primary metric here. It measures the volume of the product relative to the volume of the shipping container. If your cube utilization is low, you’re effectively paying to ship air. Research indicates that most brands operate with a dimensional (DIM) weight efficiency ratio between 0.3 and 0.5, meaning they pay higher prices on 50% to 70% of their shipments. Tracking your packaging spend as a percentage of Cost of Goods Sold (COGS) helps identify if your material costs are scaling efficiently with your production volume.
Reducing Dimensional Weight Surcharges
Carrier enforcement has tightened in 2026 with the widespread use of automated measuring systems. For all major parcel carriers, including UPS, FedEx, and USPS, the billable weight for domestic shipments is now calculated using a DIM divisor of 139. If your team relies on oversized, standard-sized corrugated boxes, you’re likely incurring significant surcharges every time a truck leaves the dock. A key KPI for logistics managers is the “right-sizing” ratio across your SKU library. By switching to custom-engineered fits, you can lower freight costs and see a direct ROI on the initial design investment. You should track the reduction in billed weight versus actual weight as a monthly metric to validate the financial impact of custom sizing.
Material Waste and Sustainability Metrics
Operational efficiency also depends on material consumption within the warehouse. Measuring scrap rates during the packing process reveals if your team is using excessive dunnage or failing to use materials accurately. For palletized loads, you should track the amount of stretch film used per pallet. Over-wrapping doesn’t just increase material costs; it adds unnecessary labor time and plastic waste. Another valuable metric is the lifecycle cost of your shipping assets. Evaluating the lifespan of reusable crates against the cost of one-way corrugated containers allows you to find the “sweet spot” of protection versus weight. By monitoring these financial and logistics KPIs, you ensure your packaging system supports fiscal responsibility while maintaining the logistical flow of your industrial supply chain.
Procurement & Supply Chain KPIs: Ensuring Reliability
Reliability is the silent backbone of packaging effectiveness. A manufacturer can have the best-engineered foam inserts and the lowest freight rates, but if the materials aren’t on the warehouse floor when the production line finishes, those savings evaporate. When determining how to measure packaging effectiveness KPIs, procurement teams must track stockout frequency. Every hour of downtime caused by missing pallets or crates represents lost revenue that far exceeds the cost of the packaging itself. Measuring lead time variability is equally important; a supplier who delivers in three days one week and ten days the next creates logistical chaos. You also need to monitor order accuracy to ensure the custom sizes and mil-spec packaging you ordered match the exact specifications received on your dock.
The Value of Vendor Managed Inventory (VMI)
Implementing a Vendor Managed Inventory (VMI) program effectively automates your KPI tracking for stock levels. Instead of your team manually counting corrugated boxes, the supplier takes responsibility for maintaining agreed-upon inventory tiers. This shift drastically reduces emergency rush orders, which are notoriously expensive and disrupt warehouse flow. One of the most impactful metrics to track after implementing VMI is “Square Footage Saved.” By letting a local partner hold your bulk inventory, you reclaim valuable floor space for production or high-value inventory. This lean approach ensures that your primary focus remains on manufacturing rather than managing a mountain of packaging material.
Just-In-Time (JIT) Performance Metrics
Just-In-Time (JIT) management is essential for Southern California manufacturers in Orange County and Los Angeles where warehouse space is at a premium. On-time delivery rates for custom-engineered foam and crates are the lifeblood of a successful JIT system. If a supplier fails to meet a delivery window, the entire “pull” system breaks down, leading to production bottlenecks. By reducing on-hand stock, you significantly improve cash flow and lower your total cost of ownership. Evaluating local versus national suppliers is a key part of this strategy; local providers offer next-day delivery capabilities that national vendors simply can’t match. Mastering how to measure packaging effectiveness KPIs in the supply chain ensures that your logistics are as durable and reliable as the products you ship.
How to Implement a Packaging KPI Dashboard
Creating a functional dashboard requires moving beyond raw data to actionable insights. To begin, you must audit your current shipping damage and freight surcharges to establish a baseline. Without this starting point, it’s impossible to track the ROI of new designs or material changes. When determining how to measure packaging effectiveness KPIs, your dashboard should prioritize the three metrics that most heavily impact your specific business model. For example, an aerospace manufacturer might focus on Damage Frequency Rate and mil-spec compliance, while a high-volume e-commerce distributor would prioritize cube utilization and DIM weight efficiency. High-level visibility allows stakeholders in Purchasing and Operations to make informed decisions that protect margins.
Continuous improvement is only possible through consistent data review. You should schedule quarterly reviews to adjust your packaging specifications based on the trends seen in your dashboard. If damage rates spike during a specific season, your data will reveal whether the issue lies in material fatigue or carrier handling. Working with an experienced partner to conduct a packaging cost-savings analysis provides the technical expertise needed to interpret these trends. This collaborative approach ensures that your packaging remains optimized for both protection and fiscal performance as your production volume scales.
Step-by-Step Data Collection
Reliable data collection starts on the warehouse floor. You can leverage your Warehouse Management System (WMS) to track real-time packaging usage and identify which SKUs are consuming the most material. For the receiving team, a simple damage reporting log is essential for capturing the “why” behind every RMA. This log should distinguish between external box damage and internal product failure. Finally, your logistics team must review carrier invoices monthly. By flagging recurring dimensional weight penalties, you can pinpoint exactly which box sizes need custom-engineered replacements to eliminate unnecessary freight spend.
Partnering with Packaging For Industry (PFI)
Packaging For Industry (PFI) acts as a strategic consultant for Southern California businesses looking to refine their supply chain metrics. We specialize in helping manufacturers in Anaheim, Orange County, and Los Angeles lower packaging costs through data-driven design and engineering. Our team doesn’t just provide boxes; we provide a comprehensive oversight system that includes vendor-managed inventory and just-in-time delivery. This local support ensures that your packaging is never a bottleneck for your production or a drain on your bottom line. By mastering how to measure packaging effectiveness KPIs with PFI, you gain the peace of mind that comes from a steady, dependable, and optimized logistics operation.
Turn Your Packaging Data Into a Competitive Advantage
Knowing how to measure packaging effectiveness KPIs transforms packaging from a passive expense into an active driver of operational performance. The core principle is straightforward: stop evaluating packaging by unit price alone and start measuring it by its total impact on damage rates, freight costs, and supply continuity.
The manufacturers who gain the most ground are those who act on their data. If your Damage Frequency Rate is climbing, custom-engineered foam or corrugated solutions can resolve it. If DIM weight surcharges are eroding your margins, right-sized designs eliminate the problem at the source. If stockouts are disrupting production, a VMI program removes the risk entirely.
PFI supports Southern California manufacturers with local next-day delivery, free prototyping for custom industrial designs, and deep expertise in aerospace and mil-spec packaging. Whether you’re building your first KPI dashboard or refining an existing system, our team can identify exactly where your packaging spend is leaking and engineer a solution that holds.
Your next shipment should work harder for your bottom line, and it can.
Frequently Asked Questions
What are the most important KPIs for industrial packaging?
Damage Frequency Rate (DFR), cube utilization, and stockout frequency are the most critical metrics for manufacturers. DFR measures the structural integrity of your materials, while cube utilization tracks how much “air” you’re shipping. Stockout frequency monitors whether your procurement matches your production speed. Tracking these metrics allows you to identify exactly where your supply chain is losing money. It’s the foundation of how to measure packaging effectiveness KPIs for any industrial operation.
How can I calculate the ROI of switching to custom packaging?
You calculate ROI by comparing the reduction in freight surcharges and damage claims against the initial design and material costs. If a custom box reduces your billable DIM weight by several pounds per shipment, the freight savings often cover the prototyping costs within weeks. You should also factor in the labor time saved by using kitted solutions that assemble faster than standard RSC boxes with separate dunnage and fillers.
What is dimensional weight and why does it matter for my KPIs?
Dimensional (DIM) weight is a billing technique carriers use to charge for the space a package occupies, not just its actual weight. For 2026, major carriers like UPS and FedEx use a divisor of 139 for domestic shipments. If your box is unnecessarily large, you’re paying for a weight class you don’t actually need. This makes cube utilization a high-priority KPI for any manufacturer shipping bulk goods through parcel networks.
How does Vendor Managed Inventory (VMI) improve packaging effectiveness?
VMI improves effectiveness by eliminating supply chain bottlenecks and reducing on-hand inventory costs. Your supplier monitors your stock levels and replenishes materials automatically, which directly lowers your stockout frequency KPI. This system also frees up warehouse floor space, allowing you to track square footage saved as a tangible operational gain. It replaces reactive ordering with a steady, predictable flow of custom corrugated and foam materials.
What is a “good” damage frequency rate for industrial shipping?
While the industry average for transit damage is typically between 3% and 4%, a good rate depends on your specific sector. For aerospace or medical manufacturing, your target should be as close to zero as possible due to the high cost of replacement and specialized compliance. If your current rate exceeds 1%, it usually indicates that your foam inserts or box strength aren’t engineered correctly for the modern shipping environment.
How can I measure the effectiveness of my current foam inserts?
You measure foam effectiveness by analyzing the correlation between transit damage and specific impact points on your product. If components consistently fail in the same area, your current polyethylene or ESD foam isn’t providing adequate shock absorption. Using ISTA 3E-2026 testing standards for vibration and drop tests can provide data-driven proof of whether your cushioning materials are meeting the required protective thresholds for your industrial supply chain.
Can custom boxes really reduce my total shipping costs?
Yes, custom boxes reduce costs by optimizing both material usage and freight billing. Standard boxes often require excessive dunnage to fill empty space, which increases your per-unit material spend. By right-sizing the container to the product, you eliminate that extra dunnage and lower your dimensional weight. This is a primary strategy for those looking for how to measure packaging effectiveness KPIs while actively reducing their total cost of ownership.