
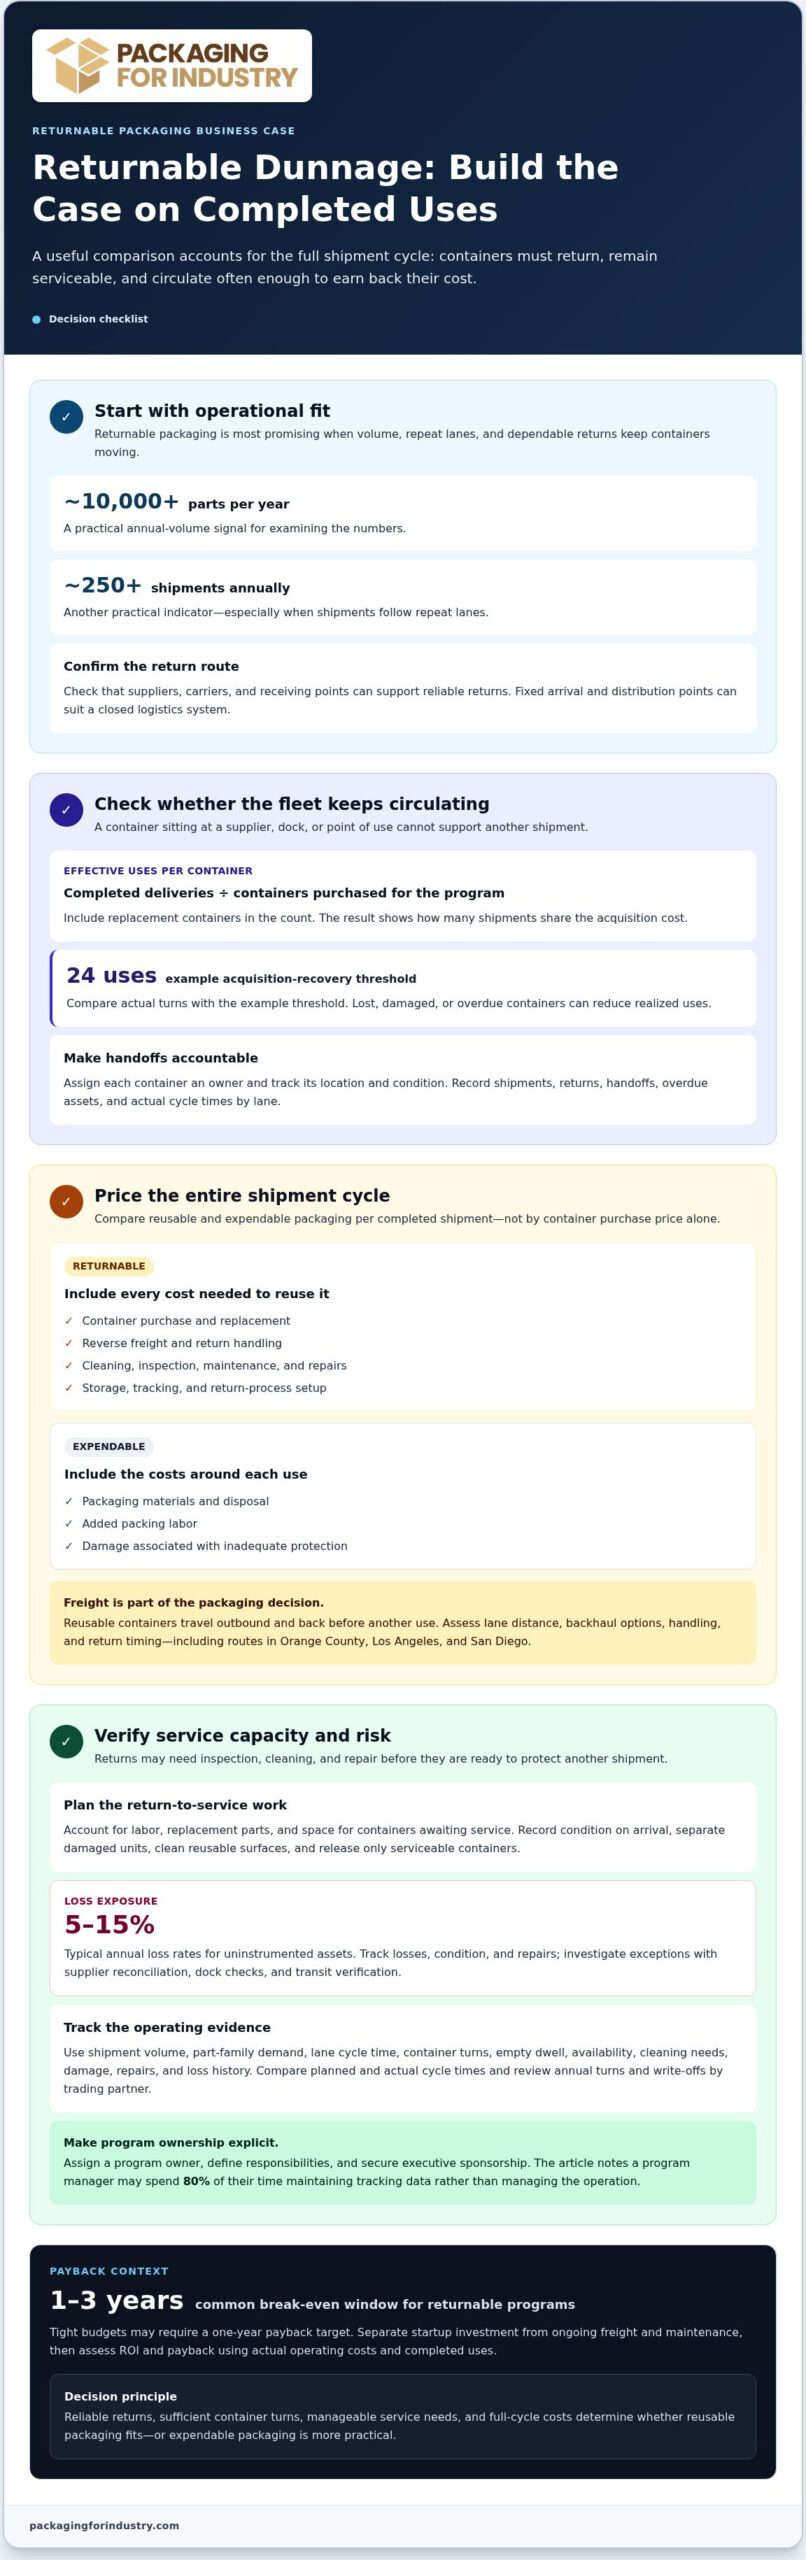
Returnable dunnage is most worth evaluating when steady volume, repeat lanes, and dependable returns keep containers circulating. Around 10,000 parts per year or more, plus an established return route, are practical signals to examine the numbers. Making the business case for a returnable dunnage program means comparing the full cost of each shipment, not just the purchase price of a container. In Orange County, Los Angeles, and San Diego, route patterns and local packaging delivery needs can shape that calculation.
Making the business case for a returnable dunnage program starts with more than comparing container purchase prices. Freight, cleaning, storage, repairs, and losses all affect the result. This article explains how to compare packaging costs, assess custom protection needs, and account for distribution-center receiving, storage, and returns. Use the right operational data to determine whether reusable packaging fits your operation or expendable packaging is more practical.
Key Takeaways
- Compare reusable and disposable packaging on a completed-use basis, including reverse freight, cleaning, maintenance, and replacement.
- Assess whether return routes and container turnaround keep enough assets circulating instead of sitting idle.
- Account for storage space, cleaning needs, and repair work as ongoing program costs, not afterthoughts.
- Balance part protection and pack quantity with transport density and ease of handling at the point of use.
- Set clear accountability for container handoffs and track dwell time, damage, and losses to identify where the program needs attention.
When does returnable packaging pay off, and when doesn’t it?
Returnable packaging is most promising when annual volume, repeat lanes, and reliable returns keep containers circulating. Around 10,000 parts per year, more than roughly 250 shipments annually, and an established return route are practical indicators.
Container Asset Ownership
Container asset ownership means assigning each reusable container a financial value, an accountable owner, and a record of its location and condition. That discipline matters because inventory sitting at a supplier or dock cannot support another shipment. A returnable program generally suits closed logistics systems with fixed arrival and distribution points. Set ownership at every handoff among suppliers, carriers, and receiving facilities.
Track container availability at shipping points and points of use, then reconcile overdue returns. Assign a program owner, define their responsibilities, and secure executive sponsorship so follow-up is part of operational work rather than an unassigned task.
Effective Uses per Container
Effective uses per purchased container equal completed deliveries divided by the number of containers purchased for the program, including replacements. This measure shows how many shipments share the acquisition cost.
The example’s acquisition-recovery threshold is 24 uses per container. Compare achieved turns with that threshold, while accounting for containers lost, damaged, or held beyond their planned cycle. A low realized-use count can undermine the economics even when planned shipment volume looks strong.
Returnable Program Cost and Payback
Total cost of ownership includes purchase, reverse logistics, cleaning, maintenance, repairs, storage, and replacement of lost containers. ROI compares net benefit with the investment, while payback measures how long cumulative savings take to recover that investment. These calculations matter because purchase price alone leaves out recurring logistics and service costs.
Typical tote, pallet, rack, and tracking costs depend on design, quantity, handling needs, and tracking approach. Returnable programs commonly break even within one to three years, while tight budgets may require a one-year payback target.
Business Case Data and Risks
A returnable dunnage proposal should use shipment volume, part-family demand, lane cycle time, container turns, empty dwell, availability, cleaning requirements, damage, repairs, and loss history. These data show whether the fleet meets demand or sits idle. Compare planned and actual cycle times by lane, and review annual turns and write-offs by trading partner.
Risks include delayed returns, excess dwell, unplanned replacement purchases, and weak accountability at handoffs. Typical annual loss rates for uninstrumented assets are 5 to 15 percent. Track losses, condition, and repair rates, then use supplier reconciliation, dock checks, and transit verification to investigate exceptions. A program manager may spend 80% of their time maintaining tracking data instead of managing the operation, making clear ownership and accessible records essential.
Why Is Freight the Hidden Cost in a Packaging Decision?
Returnable dunnage travels outbound and then back before it can be used again. Freight is therefore part of the packaging decision, not a separate logistics line. In Orange County, Los Angeles, and San Diego, assess each lane’s distance, backhaul options, container handling, and return timing. An empty return trip can change the economics even when the container’s purchase price looks attractive.
Compare returnable and expendable options by cost per completed shipment. For reusable packaging, include purchase cost divided by actual completed uses, reverse freight, cleaning, maintenance, and replacement of lost containers. For expendable packaging, include materials, disposal, added packing labor, and damage associated with inadequate protection. Environmental impact also depends on how often assets are reused and which expendable materials they replace.
These figures illustrate why completed uses and reverse freight matter more than purchase prices alone.
Upfront implementation costs include the initial container fleet and reusable inserts, plus any tracking, storage, handling, or return-process setup. Fleet quantity, container design, shipment volume, lane distance, and service requirements all shape the investment. Keep startup costs separate from ongoing freight and maintenance in the financial model.
For US planning, distinguish standards from tax incentives. ISO 18603:2013 covers associated systems for assessing reusable packaging; it does not establish a US tax incentive. Build the operational comparison without presuming a tax benefit, and evaluate tax treatment separately within the company’s financial review.
Return service also requires clear asset accountability. Record each shipment, return movement, handoff, and container condition, then compare planned and actual cycle times by lane. Identify who arranges and pays for empty returns, and track emergency expendable packaging or premium freight caused by container shortages. This makes the effect of missed returns visible in the program’s operating results.
Cleaning, maintenance, and storage costs
Before a returnable container can protect another shipment, it may need inspection, cleaning, and repair. Include labor, replacement parts, and space for containers awaiting service. For example, record each asset’s condition on arrival, separate damaged units, clean reusable surfaces, and release only serviceable containers. This sequence clarifies the labor and capacity each return requires, rather than treating container service as an incidental task.
Cleaning requirements depend on the part family, container condition, and standard required before reuse. Define acceptable condition and cleaning responsibility for each lane. Track labor, supplies, handling, and containers rejected after inspection. If a cleaning backlog delays release, include the extra inventory or substitute expendable packaging needed to keep shipments moving. Reviewing this data by container type can reveal avoidable handling or service steps.
Storage adds cost when containers wait at suppliers, cross-docks, or plants instead of circulating. One example describes 60 days of supplier dwell when the target is 10 days. That delay ties up inventory and may require additional purchases to cover the same demand. Track empty dwell by location and partner, compare actual time with the planned return cycle, and identify where containers accumulate. Warehouse space consumed by idle assets also competes with production materials.
Include empty-container transport and any consolidation handling in the cost of each return loop. Compare planned routes with actual movements, since a detour or missed backhaul affects both cost and availability. Record empty-container miles, loads, and turnaround by lane. If return freight requires separate arrangements, include that work in the cost per completed use rather than assuming containers return without added operational cost.
Sustainability accounting should include both reusable-container service and the expendable packaging it displaces. Returnables can reduce single-use packaging waste and potential sources of parts contamination. The benefit depends on completed reuse, container condition, and end-of-life handling. Track cycles alongside cleaning, repair, and discarded-packaging records. This gives a clearer view of material use without treating reuse alone as proof of better performance.
Container shortages can trigger emergency expendable packaging or premium freight. Track these events by lane, part family, and cause. A late return, cleaning backlog, or repair hold can disrupt supply in different ways. Assign follow-up to the handoff where the delay occurred, then compare actual recovery time with the planned cycle. This turns expedite freight from an unallocated expense into a measurable indicator of loop performance.
Organize cost records by container type and location, including service labor, cleaning, repairs, storage dwell, reverse transport, disposal, and shortage-related expedites. Compare operating costs with actual turns and expendable packaging used during disruptions. Review the results with operations and logistics to distinguish routine service costs from exceptions that need attention. This keeps the sustainability and cost assessment grounded in how the return system performs.
Part protection, pack quantity, and transport density
Returnable dunnage must protect each part while fitting the shipment and production process. Container design connects part condition, pack quantity, and freight efficiency across the supply chain.
Damage Prevention and Part Protection
Part protection means controlling movement, contact, and presentation inside the container throughout transport and handling. This matters because a damaged component can disrupt production and require inspection or replacement. Design dunnage around the part’s shape and contact points, then evaluate it through actual shipping cycles.
For a local supplier-to-plant lane, consider transfers, handling points, and the container’s condition on return. A fitted tray can separate machined components and limit contact between parts, while dividers can organize mixed parts. Returnable packaging can reduce potential contamination sources and expendable-packaging waste when containers remain clean and serviceable.
Use damage and repair records to identify weak points. A cracked divider, loose restraint, or poor part presentation may indicate that the design needs adjustment. Automotive packaging design considers protection alongside footprint, stackability, ergonomic limits, and presentation to production. Tracking damage by part family helps connect container condition with supply-chain outcomes.
Pack Quantity and Transport Density
Pack quantity is the number of parts in each container; transport density describes how effectively each load uses available space and capacity. The balance matters: more parts per container can reduce trips, but an awkward load can complicate handling. Assess the part, container footprint, stackability, and point-of-use needs together.
In a hypothetical component shuttle, each load carries 20 components between a supplier and assembly plant 120 km apart. At 100 container-load deliveries per operating day and a 10-day turnaround, normal circulation requires 1,000 containers. A 20% reserve adds 200 containers, bringing the starting fleet to 1,200. This example shows how lane demand and return timing shape fleet requirements.
If turnaround on that lane doubles to 20 days, the example requires 2,400 starting containers to maintain the same reserve percentage. Delayed returns therefore increase inventory needs even when pack quantity stays constant. Measure actual cycle time alongside container availability at shipping points and production locations.
Standard footprints can simplify stacking, storage, and freight planning, while complex shapes may need part-specific trays or racks. Documented programs have achieved freight reductions reaching around 60% through engineering returnable containers to parts. Treat that as an observed result, not a forecast. Compare load configuration, part protection, and line-side convenience before selecting a design.
Pricing return service, cleaning, repairs, and losses
Price each returnable loop using actual service activity, not a blanket allowance. For every completed shipment, record return transport, cleaning, inspection, repair labor, replacement parts, and unusable containers. Separate costs by lane and container type. A rack needing minor inspection should not carry the same service cost as a tote requiring repair. This detail shows which repeat flows use assets efficiently and which require more operational effort.
Cleaning costs depend on the condition required before reuse and the work needed to meet it. Track labor, cleaning materials, handling, and containers rejected after inspection. Divide those costs by the containers released for another shipment, not every container received. If a wash or inspection backlog delays release, include the resulting extra inventory or substitute packaging in that lane’s cost.
Set clear responsibility and decision rules for repairs. Record the damage type, location, responsible handoff, repair action, and whether the container returns to service. Compare repair cost and turnaround with replacement cost and lost availability. A recurring break at the same contact point, for example, may call for a design change instead of repeated repairs. Keep repairable, irreparable, and awaiting-assessment assets distinct in operational reports.
Loss assumptions can materially alter a proposal. One hypothetical three-year program loses or irreparably damages 300 containers after deliveries and replaces them. Include those replacements in total purchases, then calculate the resulting cost per completed shipment using actual deliveries. Don’t treat shrinkage as an unexplained reserve: attribute missing assets to suppliers, carriers, customers, or internal locations, and connect each handoff to a reconciliation process.
For a useful sensitivity review, compare planned and actual return performance under different operating conditions. Model delayed returns, increased repair demand, cleaning holds, and containers that never come back. Show how each condition changes replacement purchases, fleet availability, and service cost per shipment. Track emergency expendable packaging and premium freight separately so shortages caused by late returns do not disappear in general logistics expenses.
The proposal should assign cost ownership for every service event. Specify who pays for return freight, cleaning, damage assessment, repairs, and replacement after a loss. Use shipment records and condition reports to reconcile disputed charges with trading partners. Regular reviews can flag recurring exceptions and compare actual service costs with approved operating assumptions.
Packaging For Industry (PFI): Foam Packaging
Packaging For Industry (PFI) helps manufacturers address part protection and packaging supply needs with foam packaging. Foam can cushion products in shipping packs, with the configuration tailored to the part and handling requirements. PFI also offers Vendor Managed Inventory (VMI) and Just-In-Time (JIT) inventory management for packaging, supporting supply planning alongside a dunnage cost review.
Turn to PFI when damage prevention, packaging availability, or packaging inventory management needs attention. For a broader packaging plan, assess how protective packaging and supply processes fit your shipment flow and operating needs.
Contact Packaging For Industry (PFI) to discuss your packaging requirements.
Put Your Next Packaging Decision to Work
A returnable dunnage plan is more useful when its assumptions reflect the daily work of purchasing, shipping, and production. Use the cost model to identify the lane or part family where better protection or smoother packaging supply could have the greatest impact. Then compare the operational requirements with how your team handles packaging today.
For manufacturers reviewing protection and supply needs, Packaging For Industry (PFI) offers foam packaging, stretch film, and Vendor Managed Inventory (VMI) for packaging. These services can support product protection and inventory planning as you evaluate reusable containers. Making the business case for a returnable dunnage program means focusing the discussion on measurable operating needs, not assumptions about packaging alone.
Bring your packaging requirements and shipment needs to PFI to discuss a practical next step.
A clear packaging plan can help your team make informed decisions and keep operations moving.
Frequently Asked Questions
Expendable or returnable: what is the real difference?
The practical difference is who manages packaging after delivery and how that work is handled. With expendable packaging, receiving teams dispose of or recycle materials under site procedures, and operations in Southern California often work with commercial recycling resources like ocrecycling.com to manage high-volume scrap. A returnable arrangement adds responsibilities for custody, storage, and return coordination. Before choosing an approach, map the receiving-dock process and confirm that the container format fits existing material-handling equipment and workflows.
How do you build the business case?
Set decision criteria before preparing the proposal. Operations can define acceptable part condition and workflow fit, while finance establishes the required return on invested capital. Procurement and logistics can agree on handoff ownership and the performance needed to justify expanding the program. Making the business case for a returnable dunnage program is stronger when departments agree on approval criteria before results arrive.
What are the value drivers of a returnable system?
Value may include more consistent packaging presentation at receiving and fewer packaging variations for operators to manage. A common container format across compatible parts may also simplify staging and storage organization. Assess these operational benefits with the teams that unload and use the packaging. They can identify practical gains that purchasing records alone may not reveal.
Who should own the packaging assets: the OEM, the supplier, or a third party?
The ownership model should match control of the shipping lane and the ability to recover containers. An OEM can retain ownership when it sets packaging requirements across several suppliers. A supplier may own assets dedicated to its shipments. If parties share a fleet, document custody transfers, authorized use, and dispute resolution in the agreement. This helps prevent disagreements when containers change hands or arrive at an unexpected location.
How many reuse cycles are needed for returnable dunnage to break even against expendable packaging?
There is no single reuse count that fits every lane. The number of cycles needed depends on how long a container remains serviceable and whether each completed turn offsets the costs for that shipment. Use expected service life as a practical limit: a program cannot rely on cycles an asset is unlikely to complete. Reassess the threshold if handling conditions or repair needs change.
What savings can returnable dunnage deliver in packaging, freight, labor, and waste disposal?
Count a saving only when the operation can identify the expense or resource it actually avoids. Reduced packaging purchases may show up as a direct budget change; freed labor hours may instead create capacity for other work. Keep these outcomes distinct in financial reporting. Avoid counting the same benefit twice, such as treating a packaging change as both a full freight reduction and a separate load-efficiency saving.
How do return rates, loss, damage, cleaning, and reverse logistics affect program economics?
Set exception rules for overdue or damaged containers before shipments begin. For example, define when a receiving location reports a missing asset, who investigates, and how unresolved cases escalate. A consistent process clarifies ownership across trading partners and helps teams respond before a local issue becomes a recurring dispute. Review the rules whenever a lane, supplier, or receiving location changes.
What implementation steps and pilot metrics help validate a returnable dunnage business case?
Choose a pilot lane that reflects normal operating conditions, not just an unusually smooth shipment pattern. Before the first container moves, agree on the part family, participating sites, responsibilities, and review point. Use the pilot to test whether teams can follow the process consistently and whether the packaging fits actual receiving and production workflows. Record exceptions and operator feedback alongside formal performance measures.