
What if the primary cause of your production delays isn’t a lack of raw materials, but a failure to forecast your secondary packaging? In 2026, with containerboard prices rising by up to $70 per ton and production dropping across North America, guessing your inventory levels is a risk your bottom line can’t afford. You’ve likely felt the frustration of a stalled line due to a packaging stockout or the drain of capital tied up in slow-moving bulk inventory. Learning how to calculate packaging needs with precision is now a requirement for any efficient industrial operation.
We recognize that your goal is a seamless supply chain that doesn’t require constant firefighting. This guide provides the repeatable formulas and forecasting strategies needed to eliminate warehouse waste and stop the cycle of emergency freight costs. We’ll show you how to establish reliable reorder points and leverage local Southern California logistics to maintain flow. By the end of this article, you’ll have a clear framework to reduce your warehouse footprint while ensuring your custom components always have the protection they require.
Key Takeaways
- Move beyond simple box counting by establishing a comprehensive Packaging Bill of Materials (BOM) for every SKU in your facility.
- Learn how to calculate packaging needs using a proven formula that reconciles theoretical production targets with actual physical inventory counts.
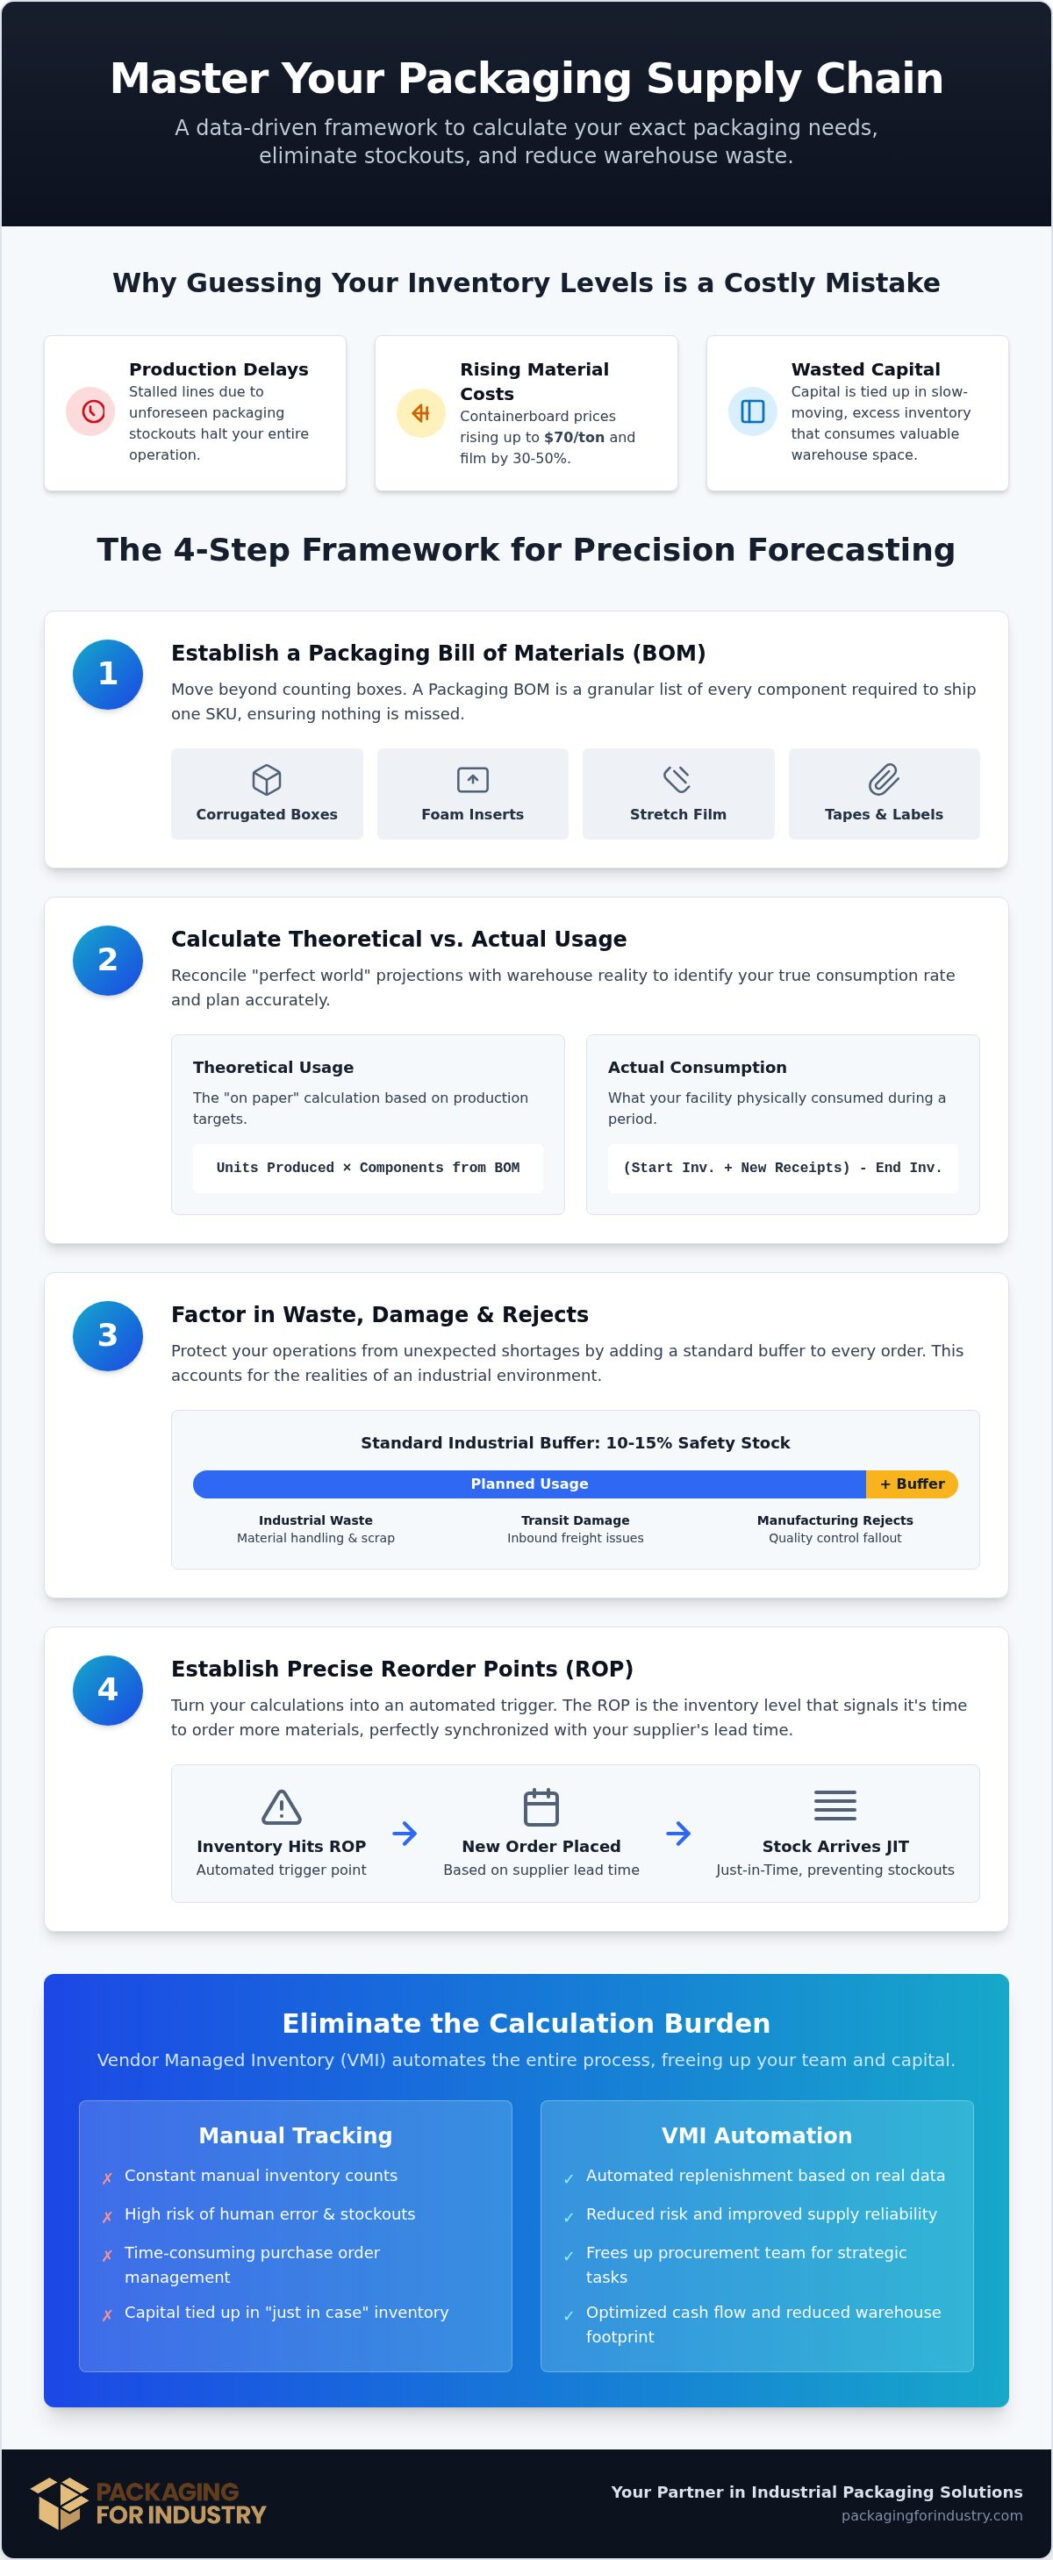
- Protect your operations from stockouts by factoring in a standard 10-15% buffer for industrial waste, transit damage, and manufacturing rejects.
- Establish precise Reorder Points (ROP) that synchronize your supply chain lead times with real-world daily usage rates to stabilize flow.
- Discover how Vendor Managed Inventory (VMI) programs can automate your replenishment and eliminate the manual burden of inventory tracking.
Step 1: Establishing Your Industrial Packaging Bill of Materials (BOM)
Industrial procurement often fails because teams count boxes instead of components. To master how to calculate packaging needs, you must first build a specialized Bill of Materials (BOM) for your shipping department. A packaging BOM is a granular list of every physical item required to move a specific SKU from your facility to the end user. While a standard manufacturing BOM focuses on the product itself, the packaging version accounts for the protection and containment that ensures the product arrives intact. You can’t guess your way to a lean warehouse. You need data.
This approach is superior to basic box counting because it captures the variables that drive up costs. If you only track corrugated usage, you’ll likely miss stockouts on specialized foam or shortages of custom labels that can just as easily halt a production line. By categorizing primary, secondary, and tertiary layers, you create a complete map of your material requirements. Assigning a specific “Usage Unit” to each SKU, such as “one custom insert per finished good” or “200 feet of film per pallet,” provides the baseline data for all future forecasting.
Mapping Components to Your Product Line
Every product line has unique requirements that dictate your inventory levels. Start by listing your custom corrugated boxes and any internal partitions required for structural integrity. For high-value sectors like aerospace or medical devices, you must include custom foam inserts or corner protection designed for specific geometries. Don’t overlook the smaller consumables. Tapes, labels, and stretch film are often the first items to run out because they aren’t tracked with the same rigor as major components. Mapping these back to the SKU ensures you never have a “lost” cost in your logistics chain.
Standardizing Units for Accurate Math
The biggest challenge in learning how to calculate packaging needs is converting bulk purchases into unit-level data. You don’t buy tape by the inch; you buy it by the case. However, your BOM must reflect the exact amount used per package. For custom foam, we use CAD/CAM prototyping to determine the precise volume of material required for each part. This level of precision prevents over-ordering and helps you distinguish between stock items and custom-engineered parts that have longer lead times. Standardizing these units allows your purchasing team to translate a production forecast of 5,000 units into a precise order for rolls, sheets, and bundles. It eliminates the guesswork and keeps the warehouse organized.
Step 2: Calculating Theoretical vs. Actual Usage Rates
Once you have established your Bill of Materials (BOM), the next step in learning how to calculate packaging needs is reconciling your office projections with your warehouse reality. Theoretical usage is a “perfect world” calculation. You determine this by multiplying your total units produced by the quantity of each component listed on your BOM. If your production schedule calls for 5,000 units and each requires two custom foam inserts, your theoretical usage is 10,000 inserts. However, relying solely on this number is a primary cause of stockouts and production downtime.
To find your actual consumption, you must perform a standard inventory reconciliation. Use the formula: (Beginning Inventory + New Receipts – Ending Physical Count). This figure represents what actually left your shelves. The discrepancy between your theoretical and actual numbers is known as the “Usage Gap.” In volatile markets where material costs for items like BOPP and PE films have risen by 30% to 50% recently, failing to account for this gap can lead to significant budgetary overruns. If your internal math consistently fails to align with your physical stock, you may want to request a packaging quote to see how a professional audit can stabilize your supply chain.
Tracking the Burn Rate Across Production Cycles
To smooth out the volatility of production spikes, we recommend using a 3-month rolling average to determine your consumption speed. This historical data allows you to adjust for seasonal shifts or high-growth phases without over-ordering generic supplies. Burn rate is the speed at which your warehouse consumes a specific packaging SKU. By tracking this rate, you can move away from reactive purchasing and toward a proactive replenishment model that mirrors your actual manufacturing throughput.
Analyzing the Usage Gap
The usage gap is rarely the result of a single error. It is typically a combination of “hidden” consumption, such as kitting mistakes, sample shipments, and internal quality testing. One effective way to narrow this gap is through professional packaging kitting. By receiving your corrugated boxes, foam inserts, and labels as a single, pre-assembled kit, you eliminate the assembly-line waste that occurs when workers pull from bulk bins. If your usage gap exceeds 5%, it is time to trigger a formal packaging review to identify where materials are being lost or misused. Reducing this waste is the fastest way to lower your total cost of ownership without sacrificing product protection.
Step 3: Factoring in Waste, Damage, and Lead Time Realities
Calculations performed in a clean office often fail to survive the friction of a real-world manufacturing floor. When you’re determining how to calculate packaging needs, you must build a buffer for the inevitable. In industrial environments, we recommend a standard 10% to 15% waste factor. This isn’t just a guess; it’s a necessary allowance for tape rolls that lose their tack, corrugated boxes damaged by forklift strikes, and manufacturing rejects that require re-packing. If your math assumes 100% efficiency, you’re essentially scheduling your next stockout.
Transit damage and lead time volatility are the two biggest threats to your logistical flow. For businesses operating in Southern California, local next-day delivery in areas like Orange County or Los Angeles can reduce the need for massive stockpiles. However, the “Lead Time Multiplier” still applies. A stock RSC box might have a 48-hour turnaround, but a custom-engineered solution requires a different forecasting model. You don’t just calculate the time it takes to ship the order; you must calculate the time it takes to manufacture it from scratch.
Calculating Safety Stock Levels
Safety stock acts as your insurance policy against supply chain volatility. The standard formula we use is: (Max Daily Usage x Max Lead Time) – (Average Daily Usage x Average Lead Time). This calculation is vital for specialized sectors like aerospace packaging, where strict compliance and custom components mean you can’t simply buy a replacement off the shelf if you run out. When you’re running a just-in-time (JIT) operation, your safety stock math must be even more precise to prevent a single missing label from halting a multi-million dollar assembly line.
The Custom Design Lead Time Factor
Custom items don’t follow the same rules as stock supplies. When you’re working with custom design packaging, you have to account for the prototyping and engineering phases. At PFI, we provide free prototyping, but that phase should still be built into your initial forecasting window. Long-lead items, such as custom-printed corrugated or mil-spec foam, require a proactive trigger point. If you wait until your physical count is low to reorder custom parts, you’ll likely face a gap in your supply chain that generic alternatives can’t fill. Mastering how to calculate packaging needs means knowing exactly when your custom lead times overlap with your production spikes.
Step 4: Turning Math into Reorder Points (ROP) and Triggers
The goal of learning how to calculate packaging needs is to reach a state of operational autonomy. Once you understand your burn rate and safety stock, you must establish a formal Reorder Point (ROP). The formula is direct: (Average Daily Usage x Lead Time in Days) + Safety Stock. When your physical inventory hits this specific number, it triggers a purchase order. This prevents the “panic buying” and emergency freight costs that erode your margins. You should also evaluate your Economic Order Quantity (EOQ). This calculation helps you find the most cost-effective bulk order size by weighing the price breaks of high-volume orders against the operational costs of holding that inventory on your floor.
Visual triggers are a pragmatic way to support your ROP math in the warehouse. Implementing Min/Max labeling on your racks allows floor staff to identify when stock is reaching critical levels before a stockout occurs. This creates a redundant system where physical reality backs up your digital tracking. Balancing your ROP with warehouse space is a constant challenge; it’s about finding the “sweet spot” where you have enough material to maintain flow without creating dead inventory that ties up capital.
Optimizing for Warehouse Efficiency
In Southern California, warehouse space is a premium asset. You can’t afford to over-order supplies that clutter your floor and impede movement. We often see procurement teams fall into the trap of ordering massive quantities to secure a lower unit price, only to lose those savings on storage costs. This is especially true for bulky items like Gaylord boxes. Calculating the true cost of storage is essential for manufacturing packaging strategies. Every square foot occupied by stagnant packaging is a square foot that isn’t generating revenue through production.
Automating Reorder Triggers
Manual spreadsheets are the enemy of logistical accuracy. To maintain a reliable flow, you should integrate your packaging ROPs into your broader ERP or production schedule. This automation ensures that as production targets shift, your packaging orders adjust accordingly. However, software isn’t a “set it and forget it” solution. Recurring physical audits are required to verify that your digital counts match your actual shelf stock. This discipline ensures that your initial work on how to calculate packaging needs remains accurate as your business scales and your product lines evolve.
Eliminating the Calculation Burden with Vendor Managed Inventory (VMI)
Even with the most accurate formulas, managing the day-to-day data entry required for a reliable supply chain is a heavy administrative lift. While knowing how to calculate packaging needs is a critical skill for any procurement manager, the most efficient operations choose to outsource the execution. Vendor Managed Inventory (VMI) is a strategic partnership where PFI takes full accountability for your shelf levels. We don’t just sell you boxes; we manage the entire logistical cycle so your production team never has to wait for a shipment. This eliminates the “panic buying” phase and ensures your warehouse remains lean and organized.
For manufacturers in Los Angeles, Orange County, and San Diego, this service is a game changer for floor space management. Because we provide local next-day delivery, we can maintain smaller safety stocks on your floor while keeping the bulk of your custom inventory in our regional facility. This optimizes your cash flow and frees up valuable square footage that would otherwise be occupied by slow-moving bulk supplies. You get the benefit of high-volume pricing without the burden of high-volume storage.
How PFI’s VMI Program Works
Our VMI program is built on physical verification rather than theoretical guesses. We perform scheduled on-site inventory reviews, whether weekly, biweekly, or monthly, to ensure your digital data matches the reality on your racks. This is particularly vital for automotive packaging or aerospace components where lead times for custom-engineered foam and heavy-duty corrugated are longer. We monitor your burn rate in real time and trigger replenishment orders automatically, ensuring that your custom-engineered parts are always ready before they’re needed.
The Financial Case for Outsourcing Your Calculations
The financial logic for VMI is centered on reducing your Total Cost of Ownership (TCO). By eliminating the need for manual tracking and forecasting, you reduce administrative overhead and allow your team to focus on core production. You also stop paying high-cost catalog pricing and emergency freight fees for last-minute supplies. When we manage the inventory, we assume the risk of stockouts and the burden of learning how to calculate packaging needs for every new SKU. It’s a pragmatic solution for businesses that value supply chain stability and fiscal responsibility.
Ready to stop guessing? Request a Packaging Review and VMI Quote
Stabilizing Your Industrial Supply Chain Flow
Accurate forecasting is the difference between a high-efficiency production line and one stalled by a missing corrugated box or foam insert. By integrating a formal Packaging BOM with real-world waste factors, you protect your operation against the volatility of 2026 material costs. Mastering how to calculate packaging needs allows your procurement team to shift from reactive firefighting to proactive growth. This precision ensures that your capital isn’t tied up in stagnant inventory while your assembly lines remain consistently operational.
We understand the complexities of aerospace and medical packaging compliance and the need for zero-defect delivery. Our team provides free prototyping for custom designs to ensure your specifications are perfect before you commit to a bulk order. With local next-day delivery across Southern California, we help you maintain a lean warehouse footprint without risking a stockout. We’re here to act as your steady partner in logistical optimization and fiscal responsibility.
We’re ready to help you eliminate professional stress by solving your most difficult logistical challenges. Let’s stabilize your supply chain and lower your total packaging costs together.
Frequently Asked Questions
How do I calculate how many boxes I need for a high-volume production run?
You calculate box requirements by using the formula: (Total Units Produced / Units per Master Carton) x (1 + Waste Factor). For high-volume runs, it’s vital to calculate this at the SKU level to prevent compounding errors across different product lines. As a specialized bulk packaging supplier, we recommend auditing your palletization patterns first to ensure your unit counts per carton are optimized for shipping density.
What is a standard waste factor for industrial packaging materials?
A standard waste factor for industrial environments is generally between 10% and 15%. This percentage accounts for physical damage from forklifts, assembly-line kitting errors, and manufacturing rejects that require re-packing. If you’re searching for an industrial packaging supplier near me in Southern California, we can help you audit your specific floor waste to refine this figure and lower your total overhead costs.
How do lead times for custom foam inserts affect my reorder points?
Custom foam inserts have significantly longer manufacturing lead times than stock items, which requires you to set a higher reorder point (ROP). Since these parts are custom-engineered for aerospace or medical compliance, you can’t rely on off-the-shelf substitutes if you run out. You must add the engineering and production window of the foam to your safety stock math to ensure your assembly line never stops.
What is the difference between theoretical and actual packaging usage?
Theoretical usage is based on perfect production math, while actual usage is the physical reality of what truly left your warehouse shelves. Theoretical usage doesn’t account for hidden consumption like sample shipments, internal testing, or assembly-line damage. Understanding this gap is a primary step when learning how to calculate packaging needs for high-precision manufacturing environments where margins are tight.
How can I calculate the amount of stretch film needed per pallet?
The most accurate method is to weigh a wrapped pallet and subtract the weight of the empty pallet and products. This gives you the weight of film used per wrap, which you then multiply by your total pallet forecast. Converting this weight into roll length allows you to order exactly what you need based on your specific wrap settings rather than relying on generic estimates.
Can Vendor Managed Inventory (VMI) help reduce my packaging costs?
VMI reduces costs by eliminating emergency rush fees and optimizing your warehouse floor space for revenue-generating production. By having a partner manage your counts, you avoid the administrative expense of manual tracking and the high cost of production downtime caused by stockouts. You can request a custom packaging quote to see how a formal VMI program stabilizes your monthly cash flow.
How do I forecast packaging needs for a new product launch?
Forecast for a new launch by using a pilot-run Bill of Materials (BOM) and a higher safety stock buffer of 20% to 25%. Since you don’t have historical burn rate data, this larger buffer protects against initial assembly-line learning curves and packaging redesigns. After 90 days of production, you can refine how to calculate packaging needs using actual consumption rates and historical lead times.
Why do I keep running out of packaging despite my calculations?
Stockouts often occur because the lead times in your formulas don’t reflect current market volatility or local transit delays. If your safety stock isn’t updated to account for rising containerboard lead times or regional shipping bottlenecks in Los Angeles and San Diego, your reorder trigger will fire too late. Regular physical audits are required to ensure your digital math matches your actual shelf reality.